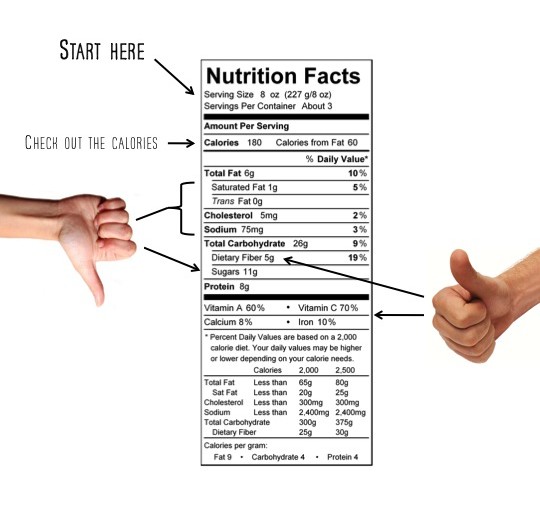
Let’s get right to the last installment of this not-so-brief nutrition label reading “how-to.” Today I’m simply sharing a chart that indicates what you should pay attention to within particular classes of food outside of serving size and calories per serving of course. For example, saturated/trans fat and sodium are important to consider when comparing snack foods like crackers, pretzels, etc., while fiber and sugar content should be more of a focus when comparing cereals. Remember, there’s no need to look at nutrition labels for fresh fruits and vegetables, whole grains, dried legumes, eggs, and fresh seafood, poultry and meat (although leaner cuts are better). They are our best options on supermarket shelves.
| Food Category | Besides serving size and calories, pay attention to… |
| Canned vegetables, legumes and soups | (-) Sodium
(-) Sugars (check the ingredients list) |
| Dried, frozen and canned fruit | (-) Sugars (check the ingredients list) |
| Packaged grain products (pasta, cereal, bread, etc.) | (-) Sodium
(-) Sugars (check the ingredients list) (+) Fiber |
| Nuts and nut butters | (-) Saturated and trans fat
(-) Sodium (-) Sugars (check the ingredients list) |
| Milk, yogurt and cheese | (-) Saturated and trans fat
(-) Sugars (check the ingredients list) |
| Frozen Entrees | (-) Saturated and trans fat (aim for less that 10% DV saturated fat and zero trans fat)
(-) Sodium (aim for less than 500 mg) (+) Fiber and protein (extra points for more than 5 g fiber, more than 20 g protein) |
| Snacks (chips, pretzels, popcorn, crackers) | (-) Saturated and trans fat
(-) Sodium (+) Fiber |
| Beverages | (-) Sugars
(Always aim for ZERO calories) |
To test your new found skills, here are two breakfast cereal nutrition labels. What do you notice? Which do you think might be a better choice? My thoughts are at the bottom of the page so you can’t cheat.
So after three posts, that’s it! Not so bad right? Right? Anybody still there? Ugh, I know. It’s hard. So here is where I tell you how to cheat. One of my favorite websites for label reading is called Fooducate. The site grades each product (A-, B+, C, etc…) based on its nutrition facts and ingredient list and prioritizes minimally processed, real foods. I have yet to come upon a rating that I find suspect. Fooducate’s mobile app allows you to scan a product’s barcode while at the supermarket so that you can make good food decisions on the spot. But even better, let me come along with you the next time you go shopping. We can work through all this together so you won’t be up the creek when your cell service decides to be spotty. Learning how to do this intuitively without the help of modern technology will guarantee you a lifelong ability to protect your grocery cart from the all too rampant devils in disguise in the supermarket today.
Cereal standoff: After noting that the two cereals have the same serving size (1 cup), I notice that Raisin Bran Crunch has 30 more calories than Kashi Go Lean (190 versus 160), 10 grams more of sugar (19 g versus 9 g) and 6 grams less of fiber (4 g versus 10 g). Reading the ingredients list on Raisin Bran Crunch, not only is sugar the second ingredient to appear, it also contains brown sugar syrup (sugar), corn syrup (sugar), molasses (sugar) and honey (sugar). Going even farther than necessary, I also see that Raisin Bran Crunch has more sodium and less filling protein, two more minuses. Yes, it is more heavily fortified with vitamins, but I’d rather get those somewhere that they’re not packaged with nearly 5 teaspoons of sugar. Winner: Kashi Go Lean!
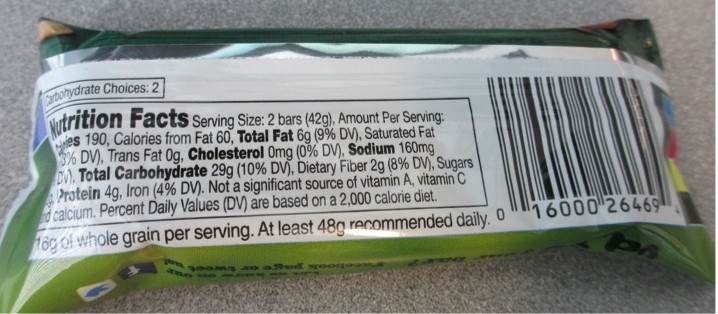
 1. The first place to start is “Serving Size,” which is always listed directly under the words “Nutrition Facts.” All of the numbers on the rest of the label are based on this value. If you eat two servings, you have to double the rest of the values. (Side note: Yes, this is what tripped up my husband.)
 The info listed on the label is for two bars, not for one as he assumed. He doubled the calories because he finished the package. Not necessary.